

A 55% market decline is not a statistic. On a $600,000 TSP balance, it is $330,000 gone from your account. On an E-8’s $280,000, it is $154,000.
The C Fund dropped approximately 55% from its peak in October 2007 to its trough in March 2009. That was not a scenario or a stress test. It happened. Service members watched their balances fall for 17 months.
How they responded depended on the behavioral pattern they were already in. But before the response comes the impact. Is your TSP safe? Every service member under BRS carries two risks that determine the answer. One is behavioral. You control it. The other is mathematical. You don’t. Most people have never had either one explained in terms of the actual dollars that leave their account.
Is Your TSP Safe From a 55% Drop?
Most risk discussions use percentages. Percentages are abstract. They let your brain process a 55% drawdown as an interesting data point rather than a financial event that removes a specific dollar amount from your retirement account.
Here is what a 55% decline looks like at different career stages.
An E-3 or E-4 in their first enlistment, three to five years of contributions in the account, might have $15,000 to $40,000 in their TSP. A 55% drop takes $8,000 to $22,000 off that balance. Painful. But they have 15 to 20 years of contributions and compounding ahead. They will barely remember it in a decade.
An E-7 or O-4 at the 12-to-15-year mark, contributing consistently, might have $150,000 to $350,000. A 55% drop takes $82,000 to $192,000. That is years of disciplined saving erased from the screen in months.
An E-8 or O-5 approaching retirement with $280,000 to $600,000, the same 55% takes $154,000 to $330,000. At that balance, the dollar amount you just lost may be larger than any single financial event in your life. Larger than what you paid for your house. Larger than what you will earn in the next two years of active duty.
| Career Stage | Approx. TSP Balance | 55% Loss | What It Equals |
|---|---|---|---|
| E-3/E-4, early career | $15,000–$40,000 | $8,000–$22,000 | A deployment’s worth of savings |
| E-7/O-4, mid-career | $150,000–$350,000 | $82,000–$192,000 | Multiple years of contributions |
| E-8/O-5, pre-retirement | $280,000–$600,000 | $154,000–$330,000 | More than most people earn in two years |
Balance ranges represent approximate accumulations at typical contribution rates and career stages. Actual balances depend on contribution percentage, years of service, fund selection, and market conditions. The The 55% decline reflects the approximate C Fund peak-to-trough loss during 2007–2009.
The same percentage hits every account. The dollar amount changes everything about how it feels, how you respond, and whether your timeline can absorb the recovery.
Your pattern determines the response. The dollars determine the stakes.
The Risk You Control
Behavioral risk is the gap between what you say you’ll do in a drawdown and what you actually do when the number on your screen drops by a third.
Your allocation pattern predicts this more reliably than most people expect. Research on stated versus revealed risk tolerance shows that the two diverge sharply under real market stress. In calm markets, most investors describe themselves as moderate to aggressive risk-takers. In falling markets, the same investors make decisions that reveal a much lower actual tolerance. They sell.
Behavioral risk has two failure modes, and they operate in sequence.
Failure mode one: panic selling. The market declines. You watch your balance shrink week after week. At some point the pain crosses a threshold and you move everything to capital preservation. That point is almost never at the top. It is after a significant portion of the loss has already happened. You have now converted a paper loss into a real one.
Failure mode two: performance chasing. The market recovers. You watch from the G Fund as the C Fund climbs. The recovery accelerates. At some point the fear of missing out overtakes the memory of the loss, and you move back to equities. That point is almost never at the bottom. It is after a meaningful portion of the recovery has already happened. You have now missed the cheapest re-entry window.
Sell after the drop. Buy after the recovery. The cycle repeats across decades of data.
Dalbar’s Quantitative Analysis of Investor Behavior has measured this gap across every major market cycle. The finding is directionally consistent across every measurement period: the average equity fund investor underperforms the fund itself. Not from picking the wrong fund. From moving in and out at the wrong times. Over a 20-year career, that behavioral drag compounds into real money. Even a small annual gap, one or two percentage points per year, grows into hundreds of thousands of dollars on a mid-career TSP balance.
If you’re a Full Equity Holder, this is the number you’re staring at: $330,000 on a $600,000 balance. The allocation is right. The question is whether your conviction will hold when you watch that amount disappear from your screen over 17 months. If that conviction is borrowed, built on a Reddit thread or a buddy’s advice rather than your own understanding of the drawdown math, the research says you will sell.
If you’re a Reactive Mover, this is the cycle you keep repeating. Out after the drop. In after the recovery. Each cycle costs a piece of your retirement that you never get back.
This risk exists regardless of which fund you hold. Even the right allocation fails if you abandon it under pressure. This is why understanding your approach matters more than the approach itself. Conviction built on education survives drawdowns. Conviction built on someone else’s conclusion does not.
The Risk You Can’t Control
The second risk is mathematical. When the losses happen in your career matters as much as how large they are.
In finance, this is called sequence of returns risk. Two service members can serve identical career lengths, contribute the same amounts, and end up with dramatically different balances. The difference is when their career happened relative to a major market event.
Two service members each invest in their TSP for 20 years. The first serves from 1988 to 2008. The second serves from 2005 to 2025. Both experience the 2008 financial crisis.
For the first, the crash arrives at the end of a 20-year career. Their balance is near its peak. The dollar loss is massive, and the remaining time to recover is measured in years, not decades.
For the second, the same crash hits three years in, when the balance is small. The dollar loss is manageable. Seventeen years of contributions and compound growth follow.
Same market event. Same career length. The first retires with significantly less, because the crash arrived when it could do the most damage.
This is not a theoretical risk. It is arithmetic. Whether your TSP is safe from a late-career crash depends on a concept that changes how you think about your timeline.
The Red Zone. When you are 5 to 10 years from your actual withdrawal age, sequence of returns risk intensifies regardless of your behavior, regardless of your conviction, regardless of how well you understand the math. Your balance is at or near its lifetime peak. A crash in this window takes the largest possible dollar amount from your account. And your remaining timeline to recover is the shortest it has ever been.
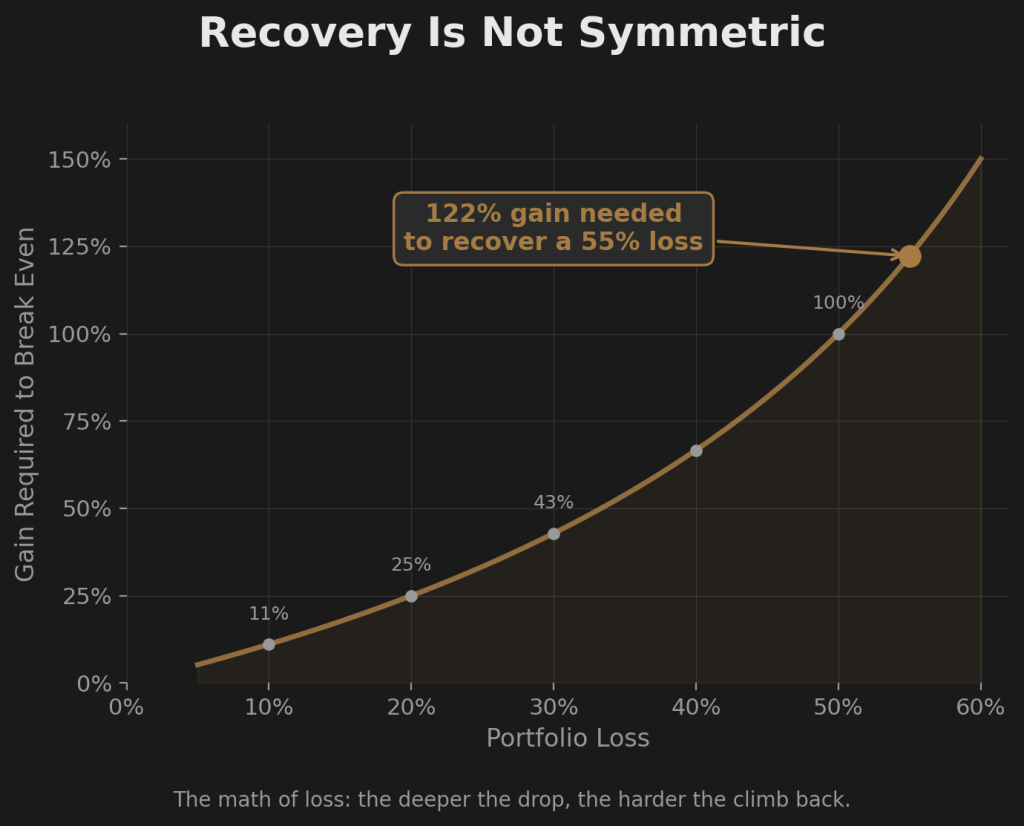
A 55% loss does not heal itself. A 55% decline requires a 122% gain just to return to the starting point. That is not a typo. Lose 55% of your balance and you need more than double that percentage in gains just to break even.
The math: if your $600,000 balance drops 55%, you are left with $270,000. To get back to $600,000 you need $330,000 in gains. That is a 122% return on the lower balance. At the C Fund’s approximate long-term average of 10% per year, that recovery takes roughly 8 years of compounding with no additional drawdowns along the way. If you are five years from needing the money, the arithmetic does not close.
| Starting Balance | After 55% Decline | Dollar Recovery Needed | Gain Required |
|---|---|---|---|
| $600,000 | $270,000 | $330,000 | 122% |
| $400,000 | $180,000 | $220,000 | 122% |
| $280,000 | $126,000 | $154,000 | 122% |
The recovery percentage is always 122% regardless of the starting amount. The dollar amount scales with your balance. The larger the balance at the moment of decline, the more real money is at stake and the longer the mathematical recovery takes.
An E-3 with $15,000 who loses 55% is down $8,250. With 18 years of contributions and compound growth ahead, that gap closes without them thinking about it.
An O-5 with $600,000 who loses 55% is down $330,000. If they are five years from withdrawal, the math says they probably cannot recover in time. Not without extraordinary returns or additional years they may not have.
Same crash. Same percentage. The timeline changes everything. Your TSP is not safe or unsafe in the abstract. It is safe or unsafe relative to your specific timeline and the size of your balance when a crash arrives.
What Happens When Both Risks Hit at the Same Time
Behavioral risk threatens every timeline. You can always panic. An E-3 with $15,000 can sell at the bottom just as easily as an O-5 with $600,000. The dollar cost is different. The psychological trigger is the same.
Math risk intensifies as your timeline shortens. The closer you are to withdrawal, the less time compounding has to repair the damage. The larger your balance, the more real dollars are at stake.
The worst case is both at once.
A crash hits when you are in your Red Zone. Your balance is near its peak. You lose $330,000 over 17 months. And instead of holding through the recovery, which would take years you may not have anyway, you panic-sell at the bottom. Now you have locked in the loss and removed yourself from whatever recovery does follow.
I’ve sat across from service members at both ends of this. The E-3 with $15,000 who sees where they’re headed if they don’t pay attention now. The O-5 with $400,000 who sees what is at stake today, in this market, with the career they have left. Same conversation. Different math. Different weight.
The early-career service member’s biggest asset is time. They can absorb the crash if they hold. The risk for them is behavioral: panic selling into a loss they had 20 years to recover from.
The late-career service member’s biggest asset is the balance they have built over a career of discipline. They cannot absorb the crash, regardless of behavior. The risk for them is mathematical: a drawdown at the wrong moment that the timeline simply cannot repair.
Your account structure adds another layer to this equation. Whether your balance sits in Traditional or Roth, whether your contributions are structured for matching, and whether you have considered tax efficiency all affect what a drawdown actually costs you in retirement dollars. But that is a separate analysis.
The question that both risks share is straightforward. What was decided before the drop?
What Both Risks Need
Behavioral risk needs understanding and conviction. You cannot white-knuckle your way through a six-figure paper loss on willpower alone. If you don’t understand why your allocation is where it is, and what the historical data says about the recovery, you will make a decision based on pain instead of math. Education is not a bonus feature. It is the structural requirement for holding through a drawdown.
Math risk needs a framework that accounts for your timeline. A 22-year-old in their first enlistment and a 50-year-old E-8 approaching retirement face different mathematical realities. The same allocation applied to both, without any mechanism for adjusting when the timeline demands it, exposes one of them to a risk that holding alone cannot solve.
Both risks need the same thing: something decided before the pressure hits. Not during the drop. Not when the number on your screen is six figures lower than it was last quarter. Before.
A set of rules that tells you when to hold, when to adjust, and why. Built when your thinking was clear. Sized against the actual dollars at risk. Designed to execute the same way whether the market is up 20% or down 40%.
The best time to understand this was day one. The second best time is today.
Is there an approach that accounts for both risks? One that builds the conviction to hold through a drawdown and has a mechanism for stepping aside when the timeline demands it?
What a rules-based framework actually does, and how to evaluate whether one is real.
Get the Full blueprint
The Firewatch Blueprint walks through the pension gap math, all four default patterns, and the full three-strategy framework. Everything in this article, plus the complete picture.

About the Author
Joshua Breaux
Retired U.S. Marine
Financial Management Analyst
BS & MBA in Analytics
His family runs on the same systems he teaches here.
This content is educational and does not constitute personalized financial advice. Millionaire Veteran is not affiliated with the Thrift Savings Plan, FRTIB, or the U.S. Government. Past performance does not guarantee future results.