

The G Fund rate was below 1% in 2020. By 2024, it climbed above 4.4%. Service members noticed. TSP G Fund rising interest rates have people asking whether the G Fund is now a better place to be.
The rate is higher. What that means for your TSP depends on something the rate alone cannot tell you.
Why the G Fund Rate Went Up
The G Fund rate is not set by the TSP or by DoD. It is calculated by the U.S. Treasury based on a weighted average of medium- and long-term Treasury securities with four or more years to maturity. (For a full breakdown of what the G Fund is and how the rate works, start there.) When Treasury yields rise, the G Fund rate rises with them.
Treasury yields rose because the Federal Reserve raised the federal funds rate aggressively starting in 2022 to combat inflation. From near zero in early 2022 to above 5% by mid-2023. The entire interest rate environment shifted. Savings accounts, CDs, bonds, and the G Fund all moved higher together.
The G Fund did not become more generous. The economic environment changed, and the G Fund rate followed. That distinction matters because the same mechanism works in reverse. When the Fed eventually cuts rates, Treasury yields fall, and the G Fund rate follows them down.
| Year | Approximate G Fund Rate | Federal Funds Rate (year-end) |
|---|---|---|
| 2019 | 2.2% | 1.55% |
| 2020 | 0.97% | 0.09% |
| 2021 | 1.4% | 0.08% |
| 2022 | 2.98% | 4.10% |
| 2023 | 4.22% | 5.33% |
| 2024 | 4.40% | 4.48% |
G Fund rates from TSP.gov. Federal funds rate from federalreserve.gov. All figures approximate.
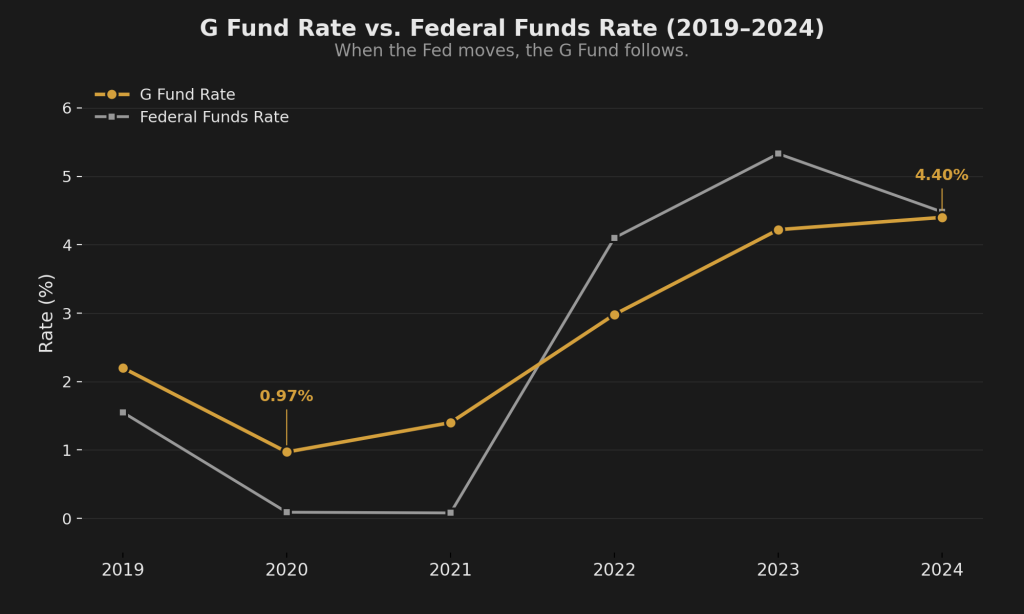
The correlation is not perfect because the G Fund tracks medium and long-term Treasury yields, not the overnight federal funds rate directly. But the direction matches. When the Fed moves, the G Fund follows within months.
What the Higher Rate Actually Buys You
A higher nominal rate feels better. Seeing 4.4% instead of 0.97% on your G Fund is encouraging. But the nominal rate is not the number that determines whether your money is growing in real terms. Inflation is the other half of the equation.
Real return = G Fund rate minus inflation. A 4.4% G Fund rate with 2.9% inflation produces a real return of approximately +1.5%. That is genuine purchasing power growth. Your money is worth more this year than last year.
Compare that to 2021: a 1.4% G Fund rate with 7.0% inflation produced a real return of approximately -5.6%. Your balance stayed intact. Your purchasing power took a significant hit.
| Year | G Fund Rate | CPI Inflation | Real Return |
|---|---|---|---|
| 2019 | 2.2% | 2.3% | -0.1% |
| 2020 | 0.97% | 1.4% | -0.4% |
| 2021 | 1.4% | 7.0% | -5.6% |
| 2022 | 2.98% | 6.5% | -3.5% |
| 2023 | 4.22% | 3.4% | +0.8% |
| 2024 | 4.40% | 2.9% | +1.5% |
The current environment is genuinely better than the 2019-2022 stretch. That is the honest assessment. For the first time in years, the G Fund is producing positive real returns. Anyone telling you the G Fund is always a losing proposition is not looking at the current numbers.
And anyone telling you the G Fund is now a great long-term growth vehicle is not looking at what comes next.
The Recency Trap
Some service members are now considering moving more of their TSP to the G Fund because 4.4% guaranteed looks attractive compared to equity market uncertainty. That instinct feels logical. It is recency bias in real time.
Recency bias is the tendency to assume current conditions will continue. Rates are high now, so rates will stay high. The data says otherwise.
Look at the table above. In 2007, the G Fund paid 4.9%. By 2012, it paid 1.5%. A service member who moved heavily into the G Fund in 2007 because the rate looked competitive rode that rate down for over a decade. They did not lose principal. They lost a decade of equity growth while earning rates that barely kept pace with inflation.
The Fed will cut rates eventually. The timing is uncertain. The direction is not. When it happens, the G Fund rate will follow Treasury yields down, the same way it followed them up. A TSP allocation built around the current rate environment is a plan built on conditions that will change.
What This Means by Pattern
If you have read The Four TSP Allocation Patterns, you already know which behavioral category you fall into. Rising rates create a different temptation for each one.
Pattern 1: The Default G-Funder. The service member whose TSP has been in the G Fund since enrollment, often without a conscious decision to put it there. Higher rates feel like validation. “See, the G Fund is paying well now.” The rate is higher. The question underneath has not changed: did you choose the G Fund for a specific reason tied to your timeline, or are you here because you never moved? A 4.4% rate on a default allocation is still a default allocation.
Pattern 2: The Full Equity Holder. The service member who put everything in equities, usually the C Fund, for maximum growth. A 4.4% guaranteed return creates a real comparison point against equity volatility. In a year where the stock market drops 15%, the G Fund’s guaranteed rate looks superior. Over 20 or 30 years, equities have outperformed the G Fund in every historical period. The comparison only works if you are looking at a one-year window. Most service members have a multi-decade window.
Pattern 3: The Default Allocator. The service member in a Lifecycle (L) Fund, trusting the automatic rebalancing to handle allocation decisions. L Funds already include G Fund exposure that adjusts automatically as your target date approaches. If you are in an L Fund, you already have a rate-appropriate G Fund allocation. Moving additional money to the G Fund on top of your L Fund is overriding the automation you chose. Make sure you are overriding for a reason, not a feeling.
Pattern 4: The Reactive Mover. The service member who shifts allocations based on what the market or rates are doing right now. Rising rates are another trigger. The impulse to shift allocations based on rate movements is the same impulse that causes panic selling during drawdowns and FOMO buying during rallies. If the rate environment is driving your TSP decisions, you are reacting to conditions instead of following a framework.
When Higher Rates Actually Matter
The G Fund has a real and legitimate purpose. Capital preservation near withdrawal. If you are within five years of starting TSP withdrawals, a 4.4% guaranteed return with zero market risk is genuinely attractive. A 40% equity drawdown at age 58 is a different problem than a 40% drawdown at age 25. The 25-year-old has 35 years of recovery runway. The 58-year-old may not recover before they need the money.
For service members in that window, higher G Fund rates are good news. The capital preservation tool is paying more than it has in over a decade. Use it for what it was designed for.
For everyone else, the rate environment is context, not a reason to change your allocation. An E-4 at age 22 with 37 years before withdrawal is not served by moving money to the G Fund because the rate looks competitive today. At 4.4%, $100,000 in the G Fund grows to approximately $500,000 over 37 years. At an average equity return of approximately 10%, that same $100,000 grows to approximately $3,400,000. The rate environment did not change the fundamental math of compounding over long time horizons. It changed how the next 12 months look.
The Rate Will Change. Your Timeline Will Not.
The G Fund rate changes. Your retirement timeline does not. A 4.4% rate today and a 1.5% rate three years from now are both the G Fund doing the same thing: preserving capital at whatever rate the Treasury sets that month. The fund did not become a different investment when rates went up. It became the same investment with a higher coupon.
Your allocation decision should be based on your timeline, your understanding of drawdown risk, and an intentional choice about how much of your TSP belongs in capital preservation versus growth. Not on which direction rates moved this quarter.
If you are not sure which allocation pattern you are in, or whether your current TSP setup matches your actual timeline, that is worth figuring out. The Four TSP Allocation Patterns walks through the four documented behavioral categories and what each one costs over a career. The answer to “should I have more in the G Fund?” starts there, not with the current rate.
The rate environment changed. Your pattern may not have.
Get the Full Framework
The Firewatch Blueprint breaks down which behavior pattern you are in, what it has cost you, and how a systematic framework addresses the gap between where you are and where the math says you could be.

About the Author
Joshua Breaux
Retired U.S. Marine
Financial Management Analyst
BS & MBA in Analytics
His family runs on the same systems he teaches here.
This content is educational and does not constitute personalized financial advice. Millionaire Veteran is not affiliated with the Thrift Savings Plan, FRTIB, or the U.S. Government. Past performance does not guarantee future results.