

If you’re asking what is the G Fund in TSP, you’re asking the right question. The G Fund is a special U.S. Treasury security available exclusively to federal employees and military members through the Thrift Savings Plan. No market exposure. No risk of losing your principal. The rate adjusts monthly based on Treasury yields.
Most service members who are in the G Fund know roughly that much. The part that matters more: whether they’re there by choice or by default.
What Is the G Fund in TSP, and What Makes It Different?
The G Fund is genuinely unique. It doesn’t work like the C Fund, S Fund, I Fund, or even the F Fund. Forget bond fund comparisons and money market analogies. This is a purpose-built Treasury security created specifically for the TSP, and no other investment vehicle in the country offers the same structure.
The government guarantees your principal under 5 USC 8438(a). Your balance cannot decline from market movement. During every market crash from 2004 to today, G Fund holders didn’t lose principal. While C Fund balances dropped roughly 50% between late 2007 and early 2009, G Fund balances continued earning their monthly rate, uninterrupted.
That guarantee is real. It’s also the reason many service members never look further.
How the G Fund Rate Is Set
The monthly rate is calculated by the U.S. Treasury based on a weighted average of medium- and long-term Treasury securities with four or more years to maturity. This is not a simple peg to the 10-year Treasury. It’s a composite figure reflecting the government’s broader borrowing costs.
In practice, the rate tracks monetary policy. When the Federal Reserve raises interest rates, Treasury yields rise, and the G Fund rate follows. When the Fed holds rates low, the G Fund rate stays low. This is the mechanism that kept G Fund returns under 2% for much of the 2010s and pushed them above 4.5% in 2024.
What service members can control: how much of their TSP sits in the G Fund. What they cannot control: the rate itself, the Fed’s policy decisions, or the inflation environment those decisions respond to. The rate is published monthly on TSP.gov.
What the G Fund Has Actually Paid
The G Fund rate has varied considerably over the past two decades, and that variation matters for how you evaluate it.
| Year | Approximate G Fund Annual Return |
|---|---|
| 2004 | 4.3% |
| 2005 | 4.5% |
| 2006 | 4.9% |
| 2007 | 4.9% |
| 2008 | 3.8% |
| 2009 | 2.9% |
| 2010 | 2.8% |
| 2011 | 2.4% |
| 2012 | 1.5% |
| 2013 | 1.9% |
| 2014 | 2.3% |
| 2015 | 2.0% |
| 2016 | 1.8% |
| 2017 | 2.3% |
| 2018 | 2.9% |
| 2019 | 2.2% |
| 2020 | 0.97% |
| 2021 | 1.4% |
| 2022 | 3.1% |
| 2023 | 4.2% |
| 2024 | 4.5% |
All figures are approximate annual returns based on TSP.gov published data. Verify against TSP.gov fund performance page for exact values.
The pattern is clear. From roughly 2010 through 2021, the G Fund returned somewhere between 1% and 3% annually, with 2020 dipping below 1%. Since 2022, rates have moved up meaningfully. In 2024, the G Fund rate has been approximately 4.5%.
For anyone researching what is the G Fund in TSP, the relevant question is not what the rate is today, but what it’s likely to average over a career. Nobody can answer that with certainty. Rates follow monetary policy, and monetary policy follows economic conditions. The 20-year average from 2004 through 2024 lands in the range of approximately 2.8% to 3.0%.
The Part Nobody Talks About: Real Return
Knowing what the G Fund pays is one number. Knowing what it pays after inflation is a different one.
Real return is simple math: G Fund rate minus inflation. If the G Fund returns 2.5% and inflation runs 3%, your purchasing power shrank by 0.5% that year. The number in your account is stable. What it can buy is less.
Here is what that looks like year by year for a representative period.
| Year | G Fund Return (approx.) | CPI Inflation (approx.) | Real Return (approx.) |
|---|---|---|---|
| 2012 | 1.5% | 1.7% | -0.2% |
| 2013 | 1.9% | 1.5% | +0.4% |
| 2014 | 2.3% | 0.8% | +1.5% |
| 2015 | 2.0% | 0.7% | +1.3% |
| 2016 | 1.8% | 2.1% | -0.3% |
| 2017 | 2.3% | 2.1% | +0.2% |
| 2018 | 2.9% | 1.9% | +1.0% |
| 2019 | 2.2% | 2.3% | -0.1% |
| 2020 | 0.97% | 1.4% | -0.4% |
| 2021 | 1.4% | 7.0% | -5.6% |
| 2022 | 3.1% | 6.5% | -3.4% |
| 2023 | 4.2% | 3.4% | +0.8% |
| 2024 | 4.5% | 2.9% | +1.6% |
G Fund returns from TSP.gov. CPI figures from BLS.gov (annual CPI-U, calendar year). Real return = nominal return minus CPI. All figures approximate.
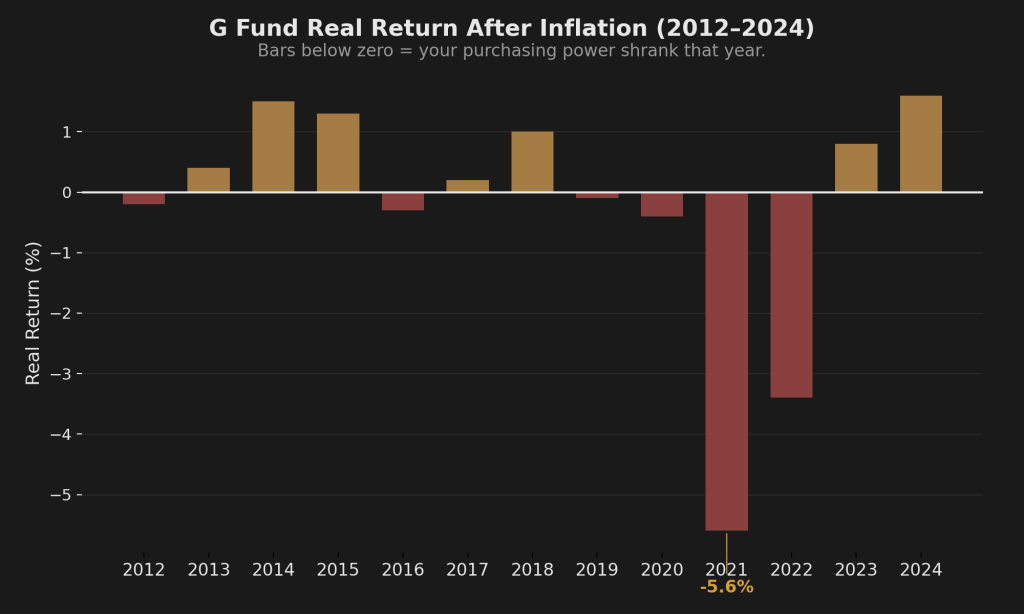
Several things stand out. In some years (2014, 2015, 2018), the G Fund delivered modestly positive real returns. In others (2016, 2019, 2020), it was approximately flat or slightly negative. Then 2021 hit. CPI inflation spiked to 7.0%, and the G Fund was still paying 1.4%. That year alone eroded purchasing power by roughly 5.6%.
The current rate environment has shifted this calculation. At 4.5% with inflation moderating toward 3%, the G Fund is generating positive real returns again. That’s the honest picture: it has not always been unfavorable, and right now it isn’t. But the decade-long experience of service members who defaulted into the G Fund from 2010 through 2021 is a real pattern with real costs.
What This Looks Like in Dollars
Take $200,000 sitting in the G Fund in 2012. Over ten years through 2022, using the approximate annual returns above, that balance grows to roughly $240,000 to $250,000 in nominal terms. Sounds like growth.
Now adjust for inflation. In 2022 dollars, the original $200,000 from 2012 would need to be approximately $238,000 just to maintain the same purchasing power. The nominal growth roughly kept pace, possibly slightly trailing. The number grew. The buying power barely moved, and in some calculations fell slightly behind.
Compare that to the C Fund over the same period. A service member with $200,000 in the C Fund in 2012, with its average annual return of approximately 13% through that decade, would have seen that balance grow to roughly $520,000 to $550,000 in nominal terms. Even adjusted for inflation, that’s approximately $430,000 to $460,000 in 2022 dollars. The gap between the G Fund and the C Fund over that single decade is not a rounding error. It is roughly $190,000 to $210,000 in real purchasing power.
For a closer look at what the C Fund has delivered across the full history, see TSP C Fund Performance: What Two Decades of Data Actually Show.
That gap is what the real cost looks like over a career when it compounds across 15 or 20 years.
Neither number is guaranteed. Both are illustrative. The C Fund also dropped roughly 50% in 2008 and 19% in 2022, which is the trade-off for that growth. But the difference between capital preservation and growth allocation over a long timeline is one of the most documented patterns in retirement investing.
Why So Many Service Members Are in the G Fund
The G Fund was the TSP default allocation before lifecycle funds were introduced. Members who enrolled, received their login, and never changed anything landed here. Millions still are.
This is Pattern 1 in the four TSP behavioral patterns: the Default G-Funder. The psychology behind it is status quo bias, documented by Samuelson and Zeckhauser (1988) as one of the most persistent forces in human decision-making. When an option is pre-selected, people keep it at dramatically higher rates than they would ever choose it from scratch. The default doesn’t feel like a choice. It feels like the way things are.
The Default G-Funder often knows the G Fund is “safe.” They’re less clear on what it costs over 20 years compared to other approaches, or whether that cost is appropriate for their timeline. The gap isn’t the fund; it’s why you’re in it.
When the G Fund Makes Sense
This fund has a real purpose. It’s not a mistake to be in the G Fund. It’s a mistake to be in it without knowing why.
The TSP G Fund makes sense when capital preservation matters more than growth. That depends on how close you are to withdrawal age.
One important distinction: military retirement (leaving active duty) can happen as early as age 38. But TSP withdrawal without penalty doesn’t start until age 59.5. A service member who “retires” from the military at 38 still has over 20 years before they touch their TSP. The timeline that matters for your G Fund decision is the distance to withdrawal age, not the distance to your separation date.
Early Career (Age 18 to 30)
An 18-year-old enlisting today has roughly 40 years before TSP withdrawal age. Even a 30-year-old has nearly 30. At those timelines, the math strongly favors growth allocation. A 50% market drawdown early in a 30-to-40-year timeline has decades to recover and then some. The G Fund removes market risk, but it also removes the compounding that time makes possible. For most early-career service members, being entirely in the G Fund carries a significant opportunity cost.
Mid-Career (Age 30 to 45)
This is where the picture gets more nuanced. You still have 15 to 30 years before withdrawal age, but you also have a larger balance. A 40% drawdown on $300,000 feels different than a 40% drawdown on $30,000. The G Fund may start to earn a small allocation as part of a broader strategy, depending on your risk tolerance and whether you have a framework for managing drawdowns. What it should not be, at this stage, is 100% of your allocation by default.
The Red Zone (Age 50 to 59, Approaching Withdrawal)
This is the G Fund’s natural habitat. When you’re within five to ten years of withdrawal age, a major market drawdown has less time to recover before you need the money. A 50% drop at age 55 is a different equation than a 50% drop at age 25. Shifting toward capital preservation, including meaningful G Fund allocation, as withdrawal age approaches is not overly conservative. It’s sequencing correctly.
Deployed or Unable to Monitor
Service members in high-risk operational environments who cannot actively manage their TSP have a legitimate case for the G Fund. Zero market risk during a period when you genuinely cannot engage with your finances is a valid use of what the fund was designed for.
Both of these last two scenarios are intentional choices. The G Fund problem isn’t the fund. It’s the service member who is there for none of these reasons and hasn’t asked the question.
The Question That Matters More Than the Rate
The G Fund rate, whatever it is this month, is less important than one question: did you choose to be in the G Fund, or did you land there by default?
If you chose it intentionally because your timeline is short or your situation warrants capital preservation, that’s a valid decision. You understand what you’re in.
If you’re there because you’ve never changed it, because it felt safe, or because you haven’t looked at your TSP allocation in a few years, that’s a different conversation. Not a judgment. Just an honest starting point.
Four documented TSP behavioral patterns. Only one involves being in the G Fund on purpose.
If you’ve been in the G Fund since enrollment and never changed it, you’re almost certainly in Pattern 1. The Four TSP Allocation Patterns walks through which pattern you’re actually in, what Pattern 1 has cost the average service member over a 15-year career, in actual dollars, and what the alternatives look like.
Get the Full Blueprint
The Firewatch Blueprint covers the real cost of each behavioral pattern over a full military career, including what the G Fund default has cost the average service member in actual dollars. It also walks through the three-strategy framework and how to match one to your timeline.

About the Author
Joshua Breaux
Retired U.S. Marine
Financial Management Analyst
BS & MBA in Analytics
His family runs on the same systems he teaches here.
This content is educational and does not constitute personalized financial advice. Millionaire Veteran is not affiliated with the Thrift Savings Plan, FRTIB, or the U.S. Government. Past performance does not guarantee future results.