

You searched the average TSP balance at retirement because you want a benchmark. You want to know whether the dollar figure sitting in your account is in the ballpark of where it should be, or whether you are behind, or whether you are doing better than you thought. The number matters and you deserve a real one.
Below is the figure the Federal Retirement Thrift Investment Board (FRTIB) reports in its most recent annual financial report, along with the median (which usually tells you more than the average) and a short walk through what each one actually measures.
Then comes the more useful part. The average TSP balance at retirement compresses every TSP holder in the system into one number. Service members who contributed five percent and switched to the G Fund in 2008. Career service members who maxed contributions in the C Fund for twenty-five straight years. Federal civilians who joined the system at forty-two. Surviving spouses who rolled accounts after separation. One number to hold all of them. The number is true in the aggregate. It is almost useless as a yardstick for your specific account because the routes that produced it varied by a factor of ten.
This is for the mid-career reader trying to figure out whether they are on track and the reader within five to ten years of separation trying to calibrate expectations. The honest answer to both: the average is the starting point, not the verdict.
The Number and the Source
According to the most recent FRTIB annual financial report, the average TSP balance across all participants is approximately $185,000. The median balance, which is the midpoint where half of all participants hold less and half hold more, is roughly $50,000. Median is usually the more useful figure because it is not skewed by a small number of very large accounts at the top.
The FRTIB also reports these figures broken out by participant status. Active participants (those still contributing) have one distribution. Separated participants (those who left service but kept their TSP) have another. Retired participants drawing from their accounts have another. The average for retired participants specifically tends to run higher than the all-participant average because retirees by definition have had a full career of contribution and compounding.
If you are looking at the average TSP balance at retirement and asking what people who actually retired from federal or military service ended their careers holding, the FRTIB-reported figure for that subset is closer to $250,000 to $300,000 depending on the report year and the specific cohort. That range is also wide because retirement timing varies and because individual careers diverge dramatically based on the factors below.
These are FRTIB-published numbers. They are the closest thing to a real benchmark that exists for TSP accounts. They are also where the useful comparison ends because the variance underneath the average is enormous.
Why the Average Is a Lousy Yardstick for Your Account
The average is the result of accumulated decisions. Twenty or thirty years of contribution rates, fund choices, and behavior under market stress, compressed into one number. The number describes what already happened to a population. It does not describe what is going to happen to you.
The average tells you where others landed; it does not tell you how to land somewhere better.
Two service members who started at the same age, contributed the same percentage of pay, and stayed in for the same number of years can end up with retirement balances that differ by a factor of three or four. Not because one of them was secretly contributing more. Because their allocation choices and their behavior during drawdowns sent them along radically different paths.
The average treats those two careers as equivalent. It puts both into the same pool and reports the mean. That is mathematically honest. It is also why the average cannot tell you whether you are on track. “On track for what?” The C Fund career has a track. The G Fund career has a different track. The lifecycle fund career has another track. The average is none of those. It is the blended midpoint of all of them.
Using the average as a yardstick has two failure modes. The reader who is above the average feels reassured and stops asking the harder question, which is whether they are allocated for the next twenty years. The reader who is below the average feels behind and either panics or stops looking. Both reactions miss what the average actually tells you, which is one true statement about a population and zero statements about your own next decision.
What Actually Determines Your Number
If contribution rate were the dominant factor, the variance in retirement balances would be small. Two careers with the same contribution percentage would end at roughly similar balances. They do not. The variance is enormous, and three factors explain almost all of it.
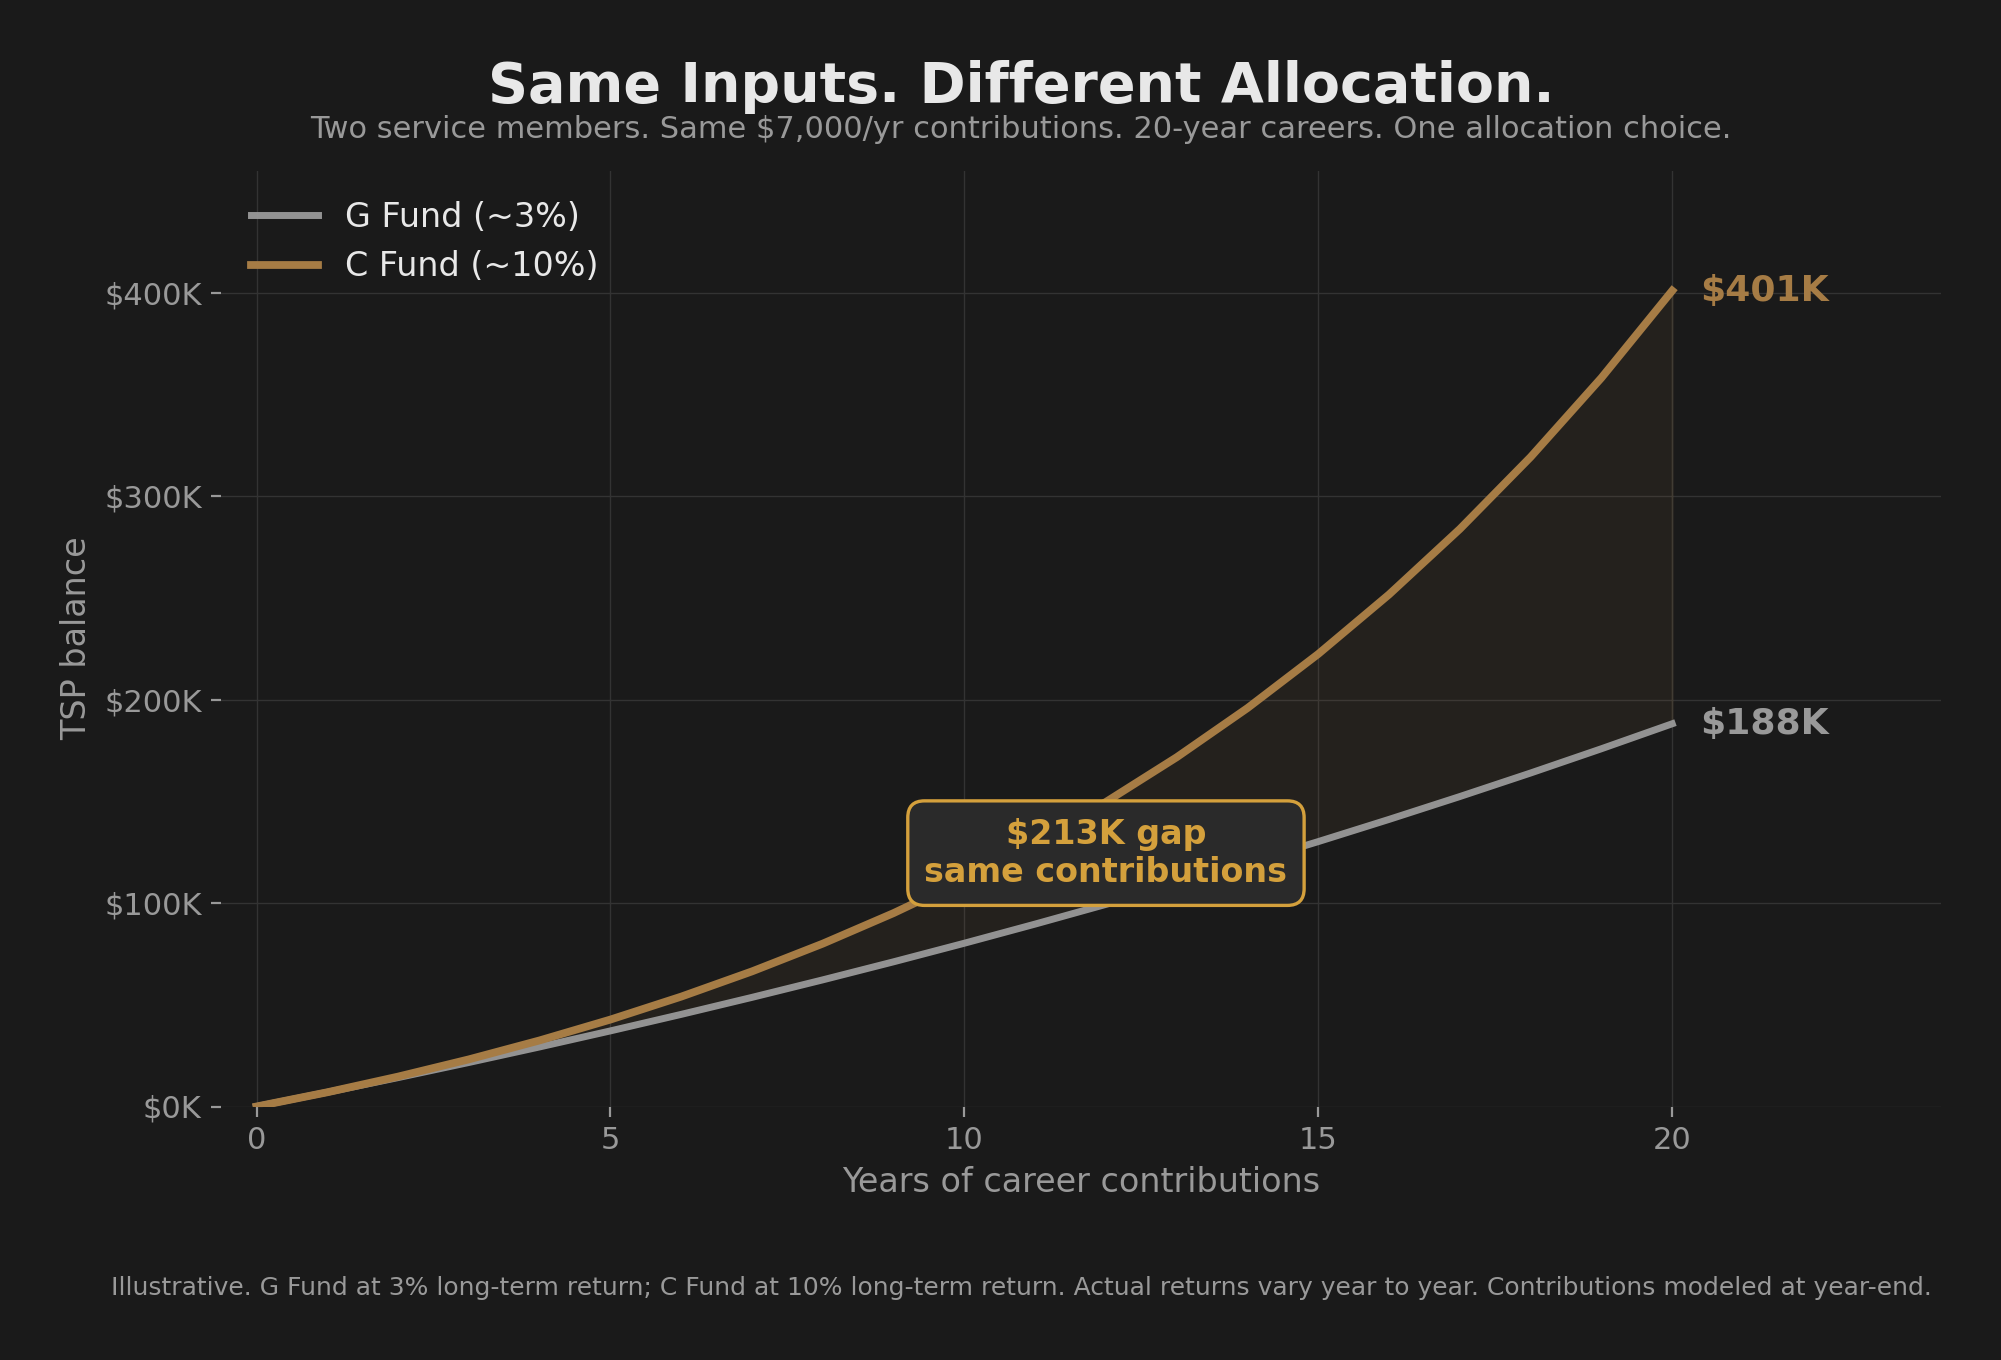
Allocation is the largest single factor. Over a twenty-year career on the same contributions, the difference between holding all G Fund and holding all C Fund is roughly a two-to-three-times divergence in the ending balance. A career-long G Fund holder contributing about $7,000 per year ends near $190,000 (illustrative, based on a 3% long-term G Fund return). A career-long C Fund holder with the same contributions, same career length, same starting age ends near $400,000 (illustrative, based on a 10% long-term C Fund return). Same contributions. Same career. Different fund. The gap is over $200,000 on a single allocation decision, and the divergence compounds further over longer careers.
If you have not read the breakdown of how allocation drives outcomes, see the four TSP allocation patterns. That article walks through the patterns most TSP holders fall into and why most of them end up underperforming what their actual fund choices should have produced.
Behavior under drawdowns is the second factor and the most under-discussed. Dalbar’s Quantitative Analysis of Investor Behavior has tracked this for decades. The average investor in equity funds underperforms the funds themselves by roughly three to four percentage points per year. Same fund. Different outcome. The gap is behavior. Panic-selling at the bottom of a drawdown and performance-chasing back in at the top happen at scale, on schedule, every cycle. Behavior eats allocation when the allocation is right but the holding fails.
This matters for TSP holders specifically because the funds are easy to switch. Two clicks on tsp.gov and you are in the G Fund. The barrier to abandoning your allocation during a drawdown is essentially zero, which means the behavioral test happens at the worst possible moment, when the news is loudest and the urge to do something is strongest. Other investment accounts have a small amount of friction at the worst moment (a brokerage call, a delay, a settlement window) that gives the panic time to fade. The TSP has no such friction. The interface is designed for fast moves, and fast moves are exactly what destroys returns during drawdowns.
Contribution rate is the third factor. It matters. Saving more is better than saving less. But at long horizons, compounding rewards time and consistency more than it rewards small contribution rate differences. A service member contributing eight percent for twenty-five years in the right allocation will out-finish a service member contributing twelve percent for twenty-five years in the wrong allocation. The order is allocation first, behavior second, contribution rate third. Most TSP content reverses this order because contribution rate is the easiest thing to write about.
The Two Risks That Explain the Spread
The reason the variance under the average is so large traces to two risks that the BRS briefing did not cover and that most TSP guidance still treats as footnotes.
Behavioral risk is the risk that you will not hold through the next drawdown. Every market cycle includes at least one twenty to thirty percent decline. Several cycles include declines deeper than forty percent. The reader who switched to the G Fund in March 2009 missed the recovery that put the C Fund up several hundred percent over the next decade. Stated risk tolerance and actual risk tolerance under pressure are different numbers, and the gap shows up in real account balances. Behavioral risk applies regardless of allocation, regardless of timeline, regardless of how thoroughly the decision was thought through in calm conditions.
Math risk, also called sequence-of-returns risk, is the risk that drawdowns hit at the wrong time in your career. A fifty-five percent loss in your last five working years cuts deeper than a fifty-five percent loss in your first five working years, even if the average return over the career is the same. The reason is recovery math: a fifty-five percent loss requires a one hundred twenty-two percent gain just to break even, and a career in the Red Zone (the five to ten years before withdrawals begin) does not have enough time to make up the gap. Two service members with the same career, the same allocation, and the same average return can land at very different balances because one of them hit a crash at year five and the other hit a crash at year twenty-two.
Both risks compound the variance under the average. Both apply to every TSP holder. Neither is in the standard briefing. The unresolved question for you is which of the two is going to be the one that hits your account, and when. The two TSP risks your BRS briefing never covered walks through how both work with the dollar math on real career stages, so you can size each against where you are.
A Better Question to Ask
The reader who looks up the average TSP balance at retirement is usually trying to answer “am I on track?” The question is honest but the yardstick is wrong. “On track” measured against an average that includes every possible career path does not point at any actionable next step.
A more useful pair of questions:
The first is forward-looking. Are you allocated for the next twenty years? Not allocated for the last twenty (that already happened). Not allocated for the news cycle (irrelevant). Allocated for the career you have left to run. If the answer is uncertain, the work to do is understanding the four patterns most TSP allocations fall into and which one your current account actually represents.
The second is behavioral. Do you have the conviction to hold the allocation through the next drawdown? Not the willpower. Conviction. The difference is that willpower depends on the moment and conviction depends on understanding. Conviction comes from knowing what each fund actually does, what each drawdown actually looks like in dollars on your balance, and what the recovery math says about timeline.
If both answers are yes, the average is irrelevant. You are on a track that will produce its own number, and the number will be the result of your decisions, not a comparison to a population. If either answer is no, that is the work. Contribution rate optimization can wait.
Your Next Step
The average is useful as context. It is not useful as a verdict. What determines your actual number is allocation first, behavior second, contribution rate third, and the analysis of why each one drives the spread lives at the two TSP risks your BRS briefing never covered. If you want the systematic answer to the allocation question, a rules-based framework that addresses both risks is the read after that.
Get the Full Framework
The Firewatch Blueprint sizes both risks against your specific career stage, walks through the recovery math, and lays out the framework designed to address the gap between what a drawdown looks like in percentages and what it costs in real dollars on your balance.

About the Author
Joshua Breaux
Retired U.S. Marine
Financial Management Analyst
BS & MBA in Analytics
His family runs on the same systems he teaches here.
This content is educational and does not constitute personalized financial advice. Millionaire Veteran is not affiliated with the Thrift Savings Plan, FRTIB, or the U.S. Government. Past performance does not guarantee future results.