

Thirty-eight states do not tax military retirement pay at all as of August 2026. The states that don’t tax military retirement pay split into two groups, and the difference between them is the first useful thing on this page. Nine tax nobody’s income. Twenty-nine run an income tax and carve military retirement pay out of it. Twelve more exempt part of it, and one jurisdiction taxes it in full.
That is the search answer, and the full breakdown is below.
Now the part that decides something. Where you settle after service is not a line on a tax return. It is the street you walk out onto every morning, the price of everything you buy, and the fixed bills you carry for as long as you stay. You live inside that choice for decades. It deserves better arithmetic than a list of state names.
Almost nobody attaches a number to the tax piece of it. The pages ranking for this question publish the list and stop, leaving you with a fact and no scale on it. The exemption is real money. Set it next to the other lines that move when you land somewhere new and it is the smallest of them.
What follows is the current treatment by category, the arithmetic on what the exemption is worth in one year and across a full retirement, and an honest read on how much weight that line deserves.
How States Actually Treat Military Retirement Pay
There are not fifty facts here. There are four categories, and categories are what a planning decision runs on. Dollar caps and age thresholds move whenever a legislature meets. Categories move far less often.
The Four Categories
No state income tax at all. Nine states tax no wage or retirement income from anyone, so retirement pay goes untaxed because everything does. Hold onto that one: it is the category most likely to fund itself elsewhere on your ledger.
Full exemption of military retirement pay. The state runs an income tax and excludes this income from it on purpose. Twenty-nine do it now, a count that has grown recently, which is why older articles get this wrong.
Partial exemption. The largest and messiest category. Four mechanics appear in it: a flat dollar cap, an age gate, a percentage or service-ratio formula, and an income phase-out that shuts the benefit off above a threshold. Which one applies to you decides whether the exemption is worth anything at your numbers.
Taxed as ordinary income. No state does this anymore. California was the last holdout and moved to a partial exclusion for tax year 2025. Any page still telling you a state taxes military retirement pay in full is out of date.
Which State’s Rules Apply to You
The residency protection that lets a service member hold one state of legal residence while stationed elsewhere attaches to active duty service, and it does not follow a retiree. Once retired pay starts, the taxing state is generally the one you live in, and 4 U.S.C. sec. 114 bars a former state of residence from taxing it. A career spent claiming a state with no income tax does not carry that treatment into retirement.
The Count, and Why Publishers Disagree
Nine plus twenty-nine is thirty-eight, and that count is a choice rather than a handed-down fact. Strict counters publish thirty-seven because Utah reaches its result through a nonrefundable credit instead of an exclusion. Looser counters publish thirty-nine because Georgia’s exemption now covers the whole pension for most retirees, and counting the District of Columbia changes the denominator entirely. Anyone giving you one clean number without showing how they built it is guessing. The stamp below reads tax year 2026, verified August 2026, and that stamp matters more than the count does.
Treatment verified August 2026, for tax year 2026. Legislatures change this every year and several have moved recently. Confirm with the state’s department of revenue before any of it decides anything.
| Category | States | What it means for retired pay |
|---|---|---|
| No state income tax at all (9) | Alaska, Florida, Nevada, New Hampshire, South Dakota, Tennessee, Texas, Washington, Wyoming | No income is taxed, so retirement pay is not either. |
| Income tax, military retirement pay fully exempt (29) | Alabama, Arizona, Arkansas, Connecticut, Hawaii, Illinois, Indiana, Iowa, Kansas, Louisiana, Maine, Massachusetts, Michigan, Minnesota, Mississippi, Missouri, Nebraska, New Jersey, New York, North Carolina†, North Dakota, Ohio, Oklahoma, Pennsylvania, Rhode Island, South Carolina, Utah‡, West Virginia, Wisconsin | The state taxes income and excludes military retirement pay from it. |
| Partial exemption (12) | California, Colorado, Delaware, Georgia, Idaho, Kentucky, Maryland, Montana, New Mexico, Oregon, Vermont, Virginia | Part of the pay is excluded. The mechanic below decides how much. |
| Taxed as ordinary income (0 states) | None | The District of Columbia taxes it in full, with no military-specific relief. |
†North Carolina: requires 20 years of service or medical retirement under 10 U.S.C. Chapter 61. See the mechanics section below.
‡Utah: reaches its result through a nonrefundable credit rather than an exclusion, also covered in the mechanics section below.
| Partial-exemption state | The mechanic |
|---|---|
| California | $20,000 excluded, only at federal adjusted gross income (AGI) under $125,000 single or $250,000 joint. Tax years 2025 through 2029 only. |
| Colorado | Age-tiered: $15,000 under 55, $20,000 at 55 to 64, $24,000 at 65 and over. |
| Delaware | $12,500 for tax year 2026, military-specific under 60 and reached through the general pension exclusion at 60 and over. Scheduled to step up beginning tax year 2027. |
| Georgia | $65,000 at any age for tax year 2026, replacing the older age-tiered amounts. |
| Idaho | Only for retirees who are disabled, 62 and over, or under 62 and working. Capped at the year’s maximum Social Security benefit and reduced by Social Security received. |
| Kentucky | Fully exempt if retired before January 1, 1998. Otherwise folded into the state’s general pension exclusion, with an added excludable percentage for pre-1998 service credit. Confirm the current dollar figure with the Kentucky Department of Revenue. |
| Maryland | $12,500 under 55, $20,000 at 55 and over. |
| Montana | The lesser of your Montana earned income or half your retired pay, for five consecutive years. No Montana earned income means no subtraction. |
| New Mexico | $30,000, no age gate, no income phase-out, permanent since 2024. |
| Oregon | A service-ratio percentage tied to service performed before October 1, 1991. |
| Vermont | Full exemption at federal AGI of $125,000 or less, proportional up to $175,000, none above. Same thresholds for every filing status. |
| Virginia | $40,000 subtraction, no age restriction, no income limit. |
What the Category Does Not Tell You
Read those two tables together and a problem shows up.
Oregon sits in the partial column. Its subtraction is a percentage tied to service performed before October 1, 1991, so anyone who entered service after that date subtracts nothing. For a current-era retiree, Oregon behaves exactly like a state that taxes the pay in full, while every roundup on the internet files it under partial exemption.
Utah runs the other direction. It sits in the full-exemption column and gets there through a nonrefundable credit equal to the state’s flat rate applied to retired pay, 4.45 percent for tax year 2026. A credit larger than your Utah tax liability is not refunded and does not carry forward. Anything above the liability is gone.
Montana caps its subtraction at your Montana earned income, so a retiree with no earned income in the state receives nothing from a benefit the tables describe as a partial exemption. North Carolina’s full deduction is conditioned on twenty years of service or a medical retirement under Chapter 61, so even the full-exemption column heading is doing work the statute does not.
The category is not the answer. The mechanic is. A category tells you which statute a state wrote, and the mechanic tells you what that statute does to an individual return. In all four states above, those two things do not match.
What the Exemption Is Worth in a Single Year
Take $40,000 a year in military retirement pay as an illustrative figure and hold it constant for the rest of this article. Among states that tax the income, marginal rates on it run from roughly 3 percent at the low end to roughly 7 percent at the high end. The multiplication:
$40,000 x 3%  =  $1,200 per year
$40,000 x 5%  =  $2,000 per year
$40,000 x 7%  =  $2,800 per year
Substitute your own projected annual figure and the rate a state actually applies to it, and you have the real size of the line you came here to find.
Two things keep that number honest. Retired pay is rarely anyone’s only retirement income, so the marginal rate that lands on it depends on everything else in the picture, and the federal layer applies wherever you live. The federal side is the larger cut and it is separate work: how the federal layer works, and how to get from gross retired pay to the number you can actually spend covers that conversion. For readers who draw Department of Veterans Affairs (VA) disability compensation, the taxable base is different, so the state exemption is worth less to them than the headline suggests.
Somewhere between $1,200 and $2,800 a year is real money by any standard, and it is also a smaller annual number than most people picture when they type the question. Both readings come out of the same multiplication.
Now Run It Across a Full Retirement
A single year understates it, and this is where the argument turns back in the exemption’s favor.
Run the middle figure across a retirement that lasts 35 years and $2,000 a year becomes $70,000. That is not a rounding error. It is a permanent, recurring difference in what your household keeps, repeating every year for as long as the retirement lasts, and it is the strongest honest case for taking the state line seriously.
The real total sits higher than the flat multiplication shows. Military retirement pay is adjusted for inflation, so the dollar amount grows over time and the tax on it grows with it. The annual difference widens rather than holding flat. That is compounding of a kind, and it comes from the same structural advantage that makes the compounding math on military pay work as well as it does.
What that total is not is an investment. The saved tax gets spent, the way most household income gets spent, so treating it as a balance growing at a market return would inflate the argument in exactly the direction this page is supposed to be skeptical of. The raw number is large enough without dressing it up.
So call it $70,000 or better, spread across decades. Hold that figure, because the only way to know whether it should move a decision is to see it standing next to the other numbers that move at the same time. Those are the numbers nobody shows you.
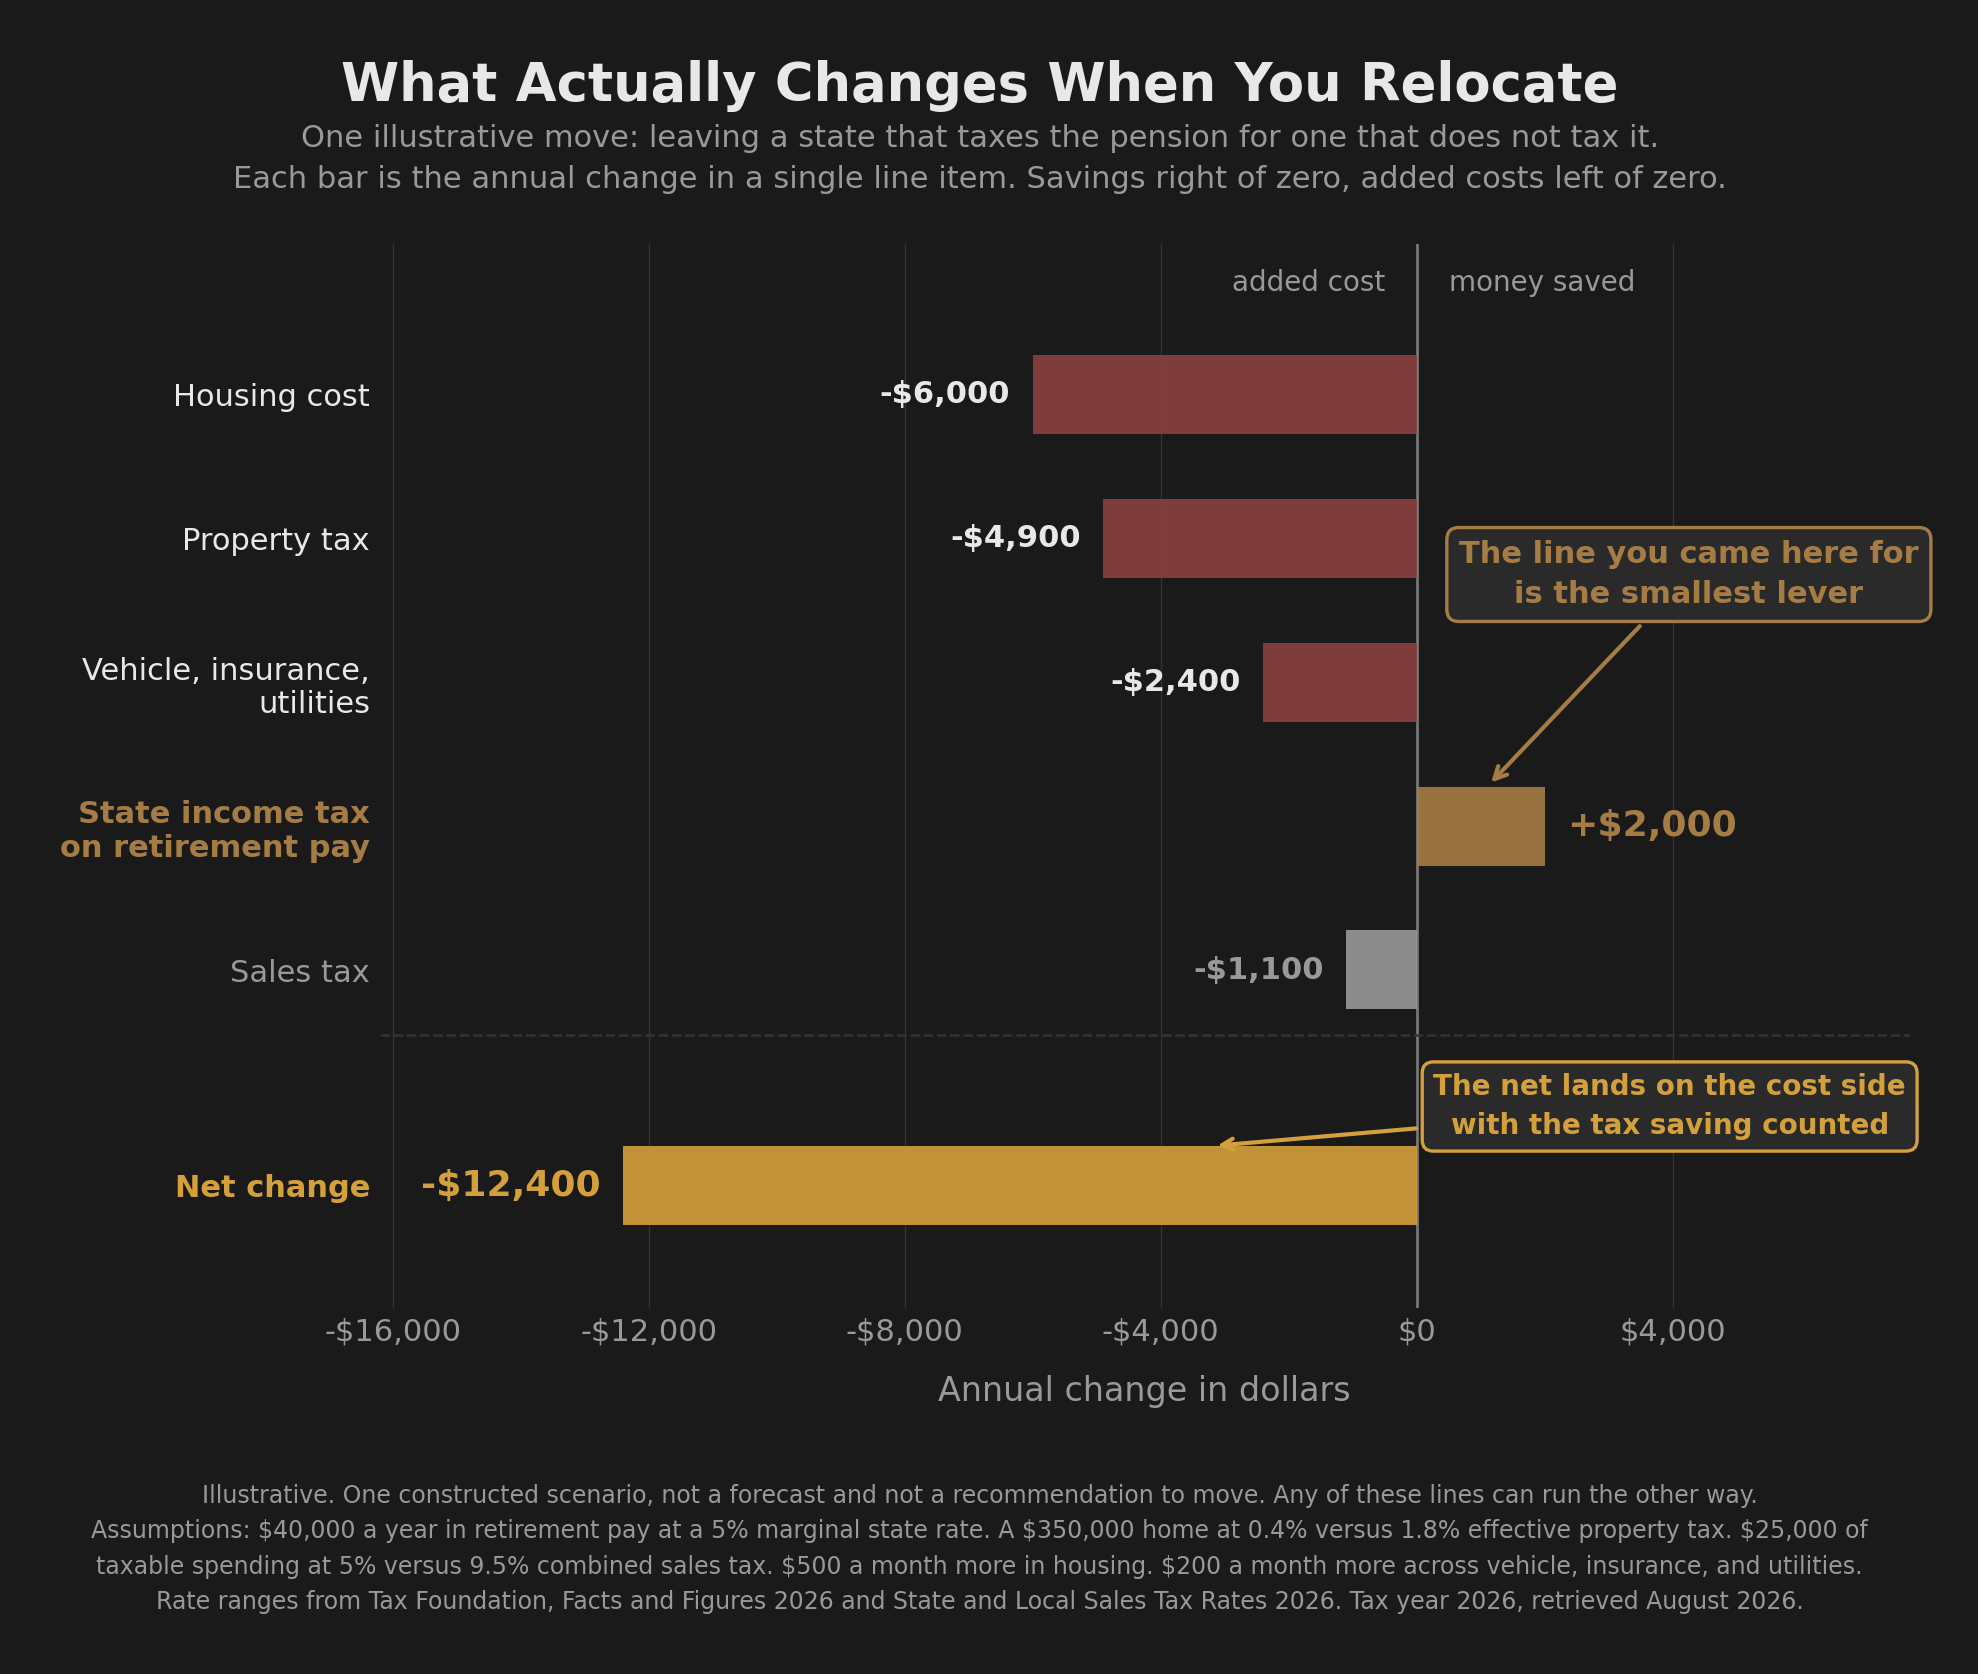
The Tax Lines That Move When You Move
Two of the nine states with no income tax carry among the highest combined state and local sales tax rates in the country, both above 9.5 percent when the Tax Foundation figures were retrieved in August 2026. Two more carry among the highest effective property tax rates, at or above roughly 1.4 percent of home value, per the Tax Foundation’s Facts and Figures 2026. That pattern is not a coincidence and it is not a criticism of anybody’s legislature. A state that takes nothing from your retirement pay still has to fund itself, and it will do that somewhere on your ledger.
Property Tax
For anyone who owns, this is the largest of the competing lines. Effective property tax rates run from roughly 0.4 percent of home value at the low end to roughly 1.8 percent at the high end. Against an illustrative $350,000 home:
$350,000 x 0.4%  =  $1,400 per year
$350,000 x 1.8%  =  $6,300 per year
A $4,900 annual swing on one line, against a $2,000 income tax saving on another. Property tax does not care whether the income funding it is a pension or a paycheck, and it is not discretionary the way spending is. Many states offer property tax relief tied to veteran status or a disability rating, the amounts vary enormously from state to state, and it is a question to put to the county rather than an assumption to build on.
Sales Tax
Smaller, steadier, and harder to see because it arrives a few dollars at a time. Combined state and local rates run from zero in a handful of states to above 9.5 percent at the top, with a national population-weighted average of 7.53 percent in the Tax Foundation’s 2026 figures. Against an illustrative $25,000 a year of taxable spending, the spread between a 5 percent state and a 9.5 percent state is roughly $1,100 a year. States also differ on whether groceries are taxed, which moves the real number more than the headline rate does.
Everything Else Priced by State
Vehicle registration, auto and homeowners insurance, and utility rates are all set locally and all vary by hundreds of dollars a year. Individually small. Collectively not. The ledger has more lines on it than the one the search results talk about, and every one of them reprices on the day you change your address.
None of that makes the income tax line fake. It makes it one of at least four lines moving at once, and the property tax swing calculated above is more than twice its size.
What “Best State for Military Retirement” Actually Means
Every article that ranks states is answering “best measured against what,” and almost none of them say which measure they used. Here is one that holds up: total annual cost of living against total after-tax income, both places, side by side, one number each.
Run that comparison and housing dominates it. The difference in what a comparable home costs between two places routinely exceeds every tax line combined, and it shows up twice, once as a purchase price and again as a permanent monthly obligation. Property tax rides on top of it. The income tax exemption is the last and smallest term in an equation whose first term is several times its size. That ordering is the whole finding, and inverting it is the mistake the phrase “best state for military retirement” invites.
The other half of the decision is not financial at all. Proximity to people who matter to you. Whether the work you want after service exists there. Access to the care you need. Whether you would be glad to wake up there. Those inputs carry more weight in a life than a tax schedule does, and they do not convert to dollars, which is exactly why the ranked lists leave them out.
So this page does not name a best state and does not rank them. It hands you the method instead: put the full annual cost of two places next to each other, housing first, then property tax, then sales tax on what you actually buy, then the income tax line, and read what is left. That remainder is the answer, and it is specific to you. A tax table is not a reason to live somewhere you do not want to live.
When the State Line Should Actually Decide Something
Three sections arguing the lever is small is not the same as arguing it is zero. Conditions exist where the state line should decide the question outright.
When two places are already close on housing and total cost of living, the tax line is the tiebreaker, and it should be. Nothing else is separating them.
When retirement pay is a large share of total retirement income, the percentage bites harder, because less other income is diluting the effect. A household with a pension carrying most of the load feels the state line more than a household drawing from several streams.
And when the choice is already between two places you would be content in, there is no reason to leave money on the table. Take the exemption.
Two cautions run the other way. A state’s treatment can change after you arrive, in either direction, and several have moved in the last few years. Planning a forty-year decision around a rule a legislature can amend is a real risk, and it cuts both ways. The second caution is the flip side of the same coin: where you live is changeable. That is what separates this from the elections signed at the retirement gate. It carries friction and cost, not finality, so do not treat it as a door that locks behind you.
Which turns the question from “which state” into “what does my whole picture look like.” And that one runs on your numbers.
Your Next Step
Listing the states that don’t tax military retirement took one paragraph. Everything after it was the work. The state line is one term. The rest of the equation is the pension itself, the plan built around it, and where you stand right now.
The state income tax line on retirement pay is real, it accumulates across decades, and it is one input in a decision with several larger ones above it. Work the larger ones next: the full military retirement planning guide lays out the pension, the benefits, and the rest of the planning picture in the order they matter. Alongside it, what a military pension is actually worth as an asset prices the income stream itself, and the six milestones between you and financial independence puts that asset in sequence with everything else you are building.
What none of this arithmetic tells you is where you currently stand, and where you stand decides how much any of it matters.
Put the Whole Picture on the Table With Your Real Numbers
The Diagnostic Review inside the Millionaire Veteran free community places you on the Azimuth Roadmap using your real numbers: take-home pay, current contributions, debts, and account balances. It is not a state tax calculator and it is not a relocation recommendation. It is a placement, so you know which milestone is actually next before you start optimizing any single line. The Compass Method is the routing layer underneath it, moving the money where the placement says it goes, every payday. The community is free and there is nothing to buy.

About the Author
Joshua Breaux
Retired U.S. Marine
Financial Management Analyst
BS & MBA in Analytics
His family runs on the same systems he teaches here.
This content is educational and does not constitute personalized financial advice. Millionaire Veteran is not affiliated with the Thrift Savings Plan, FRTIB, or the U.S. Government. Past performance does not guarantee future results.